Running an SEO agency with a small team sounds straightforward until you realize nobody actually knows what’s happening across the board.
Tasks are tracked. Clients are logged. Content moves through its workflow. The data exists – but it lives in three separate places. And every time I needed to make a real decision, I had to manually jump between databases and piece the picture together myself.
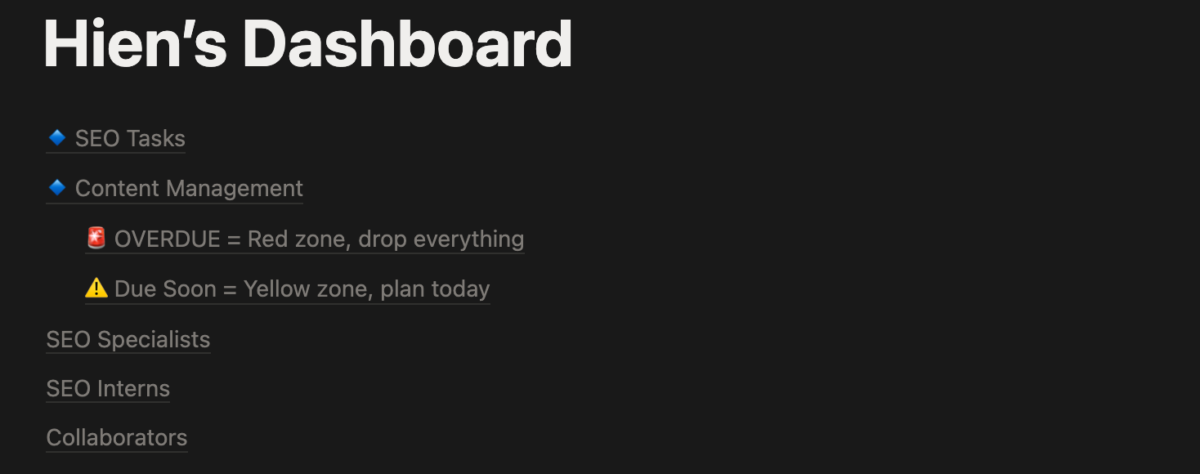
That’s when I decided to build a single dashboard that answers the questions that actually matter.
The Problem With How Most Agencies Track Work
A lot of agencies start with Google Sheets. And honestly, Sheets is a great tool – it’s flexible, everyone knows how to use it, and it’s free. The problem isn’t the tool itself. It’s what happens when a growing team tries to use it for everything.
First, one shared sheet becomes overwhelming fast. Tasks, clients, deadlines, status updates – it all piles into one place and turns into a wall of data that’s hard to navigate, especially for managers who need the big picture, not the details.
So people start creating their own sheets. Now everyone has a different version. Nothing is consistent. Nobody knows which one is up to date.
Then someone suggests everyone works in the same tab to keep things synced. That sounds logical until three people are editing the same cells at the same time and half the data gets overwritten.
And even when the data is there – tracked, logged, recorded – Sheets doesn’t surface what actually matters. Overdue tasks don’t jump out at you. Content stuck in the pipeline stays invisible. At-risk clients don’t get flagged until someone notices.
Sheets tracks activity. But it doesn’t support decisions.
That’s the gap.
Why I Built It
I managed a 5-person SEO team across 10+ client projects. On paper, everything was organized. In practice, I was the only person who could see the full picture – and only because I was constantly checking.
That’s not a system. That’s a single point of failure.
I needed one page that pulls live data from everything we already track, updates itself automatically, and gives me clear answers without manual input. No duplicating data. No extra maintenance. Just visibility where it’s needed.
The Approach
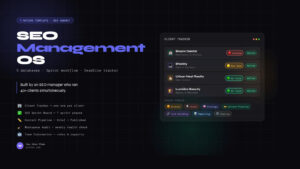
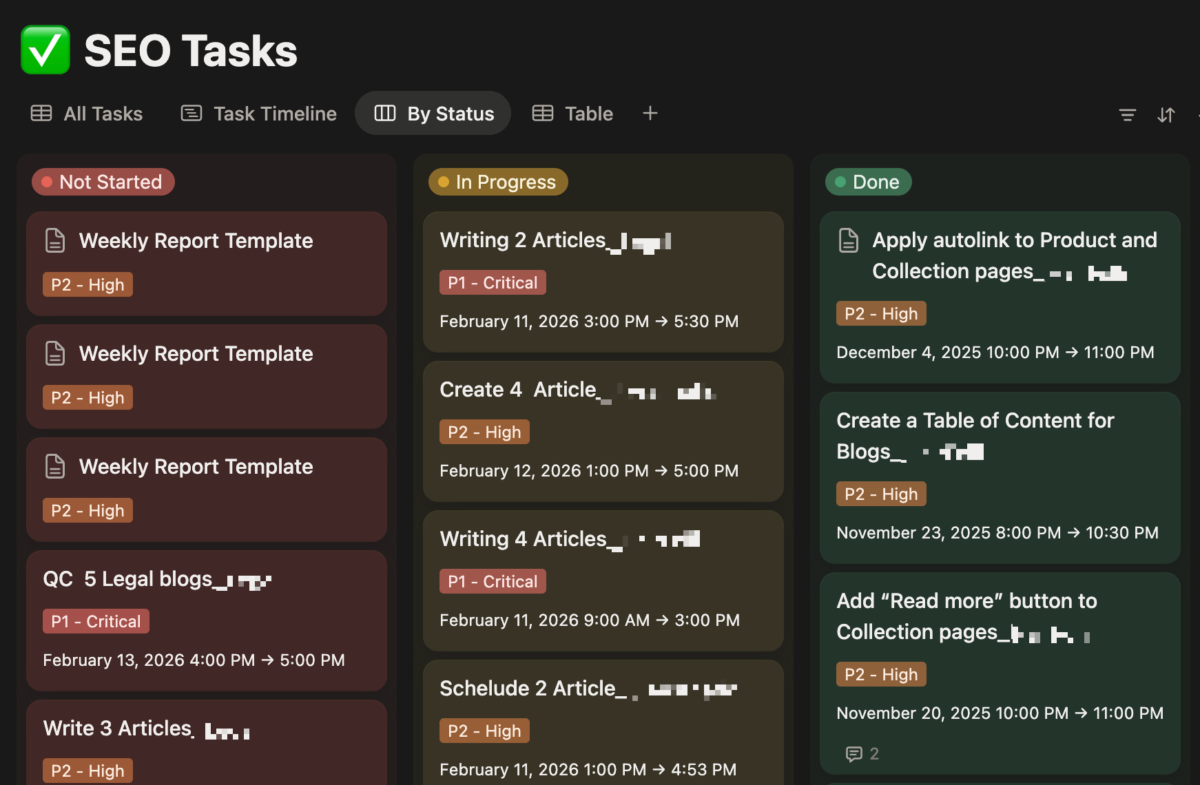
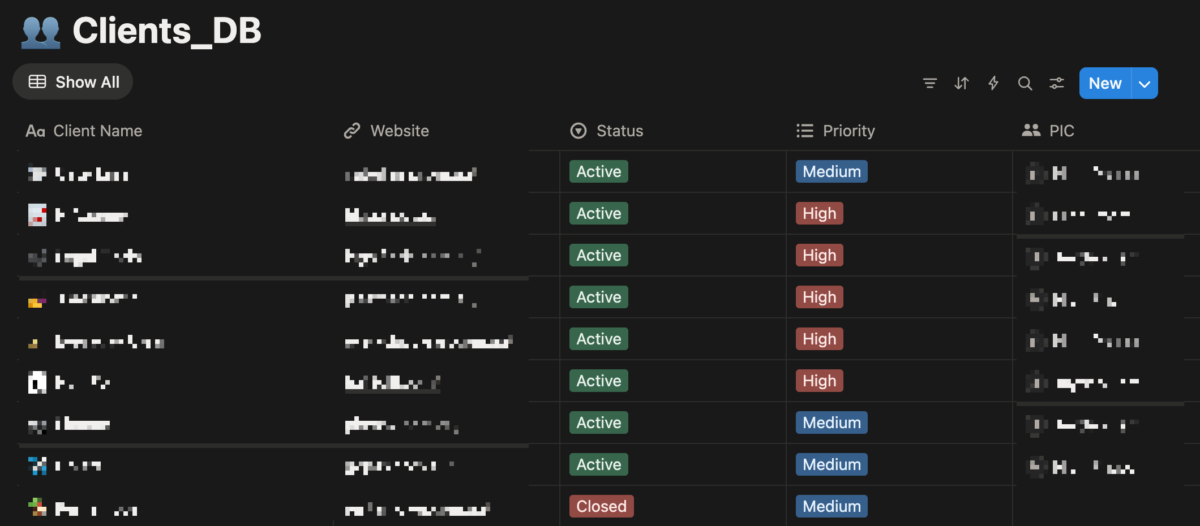
The dashboard is built on three core databases we already used: SEO Tasks, Client Management, and Content Workflow. Instead of building something new, I connected what already existed and layered automated calculations on top.
The key principle: every number on the dashboard updates itself. The moment a task status changes, a client health score updates. The moment work gets assigned, team utilization recalculates. Nothing requires manual input to stay accurate – because if it does, people stop trusting it, and it stops being used.
There were technical challenges along the way – Notion’s rollup limitations meant I had to find creative workarounds for some calculations. But the solutions ended up being more reliable than the original approach would have been.
What It Actually Answers Now
Team Capacity
Each team member has a utilization rate that updates in real time based on assigned work vs. available hours. Overloaded team members surface before anyone burns out. Under-utilized ones get flagged so work can be redistributed.
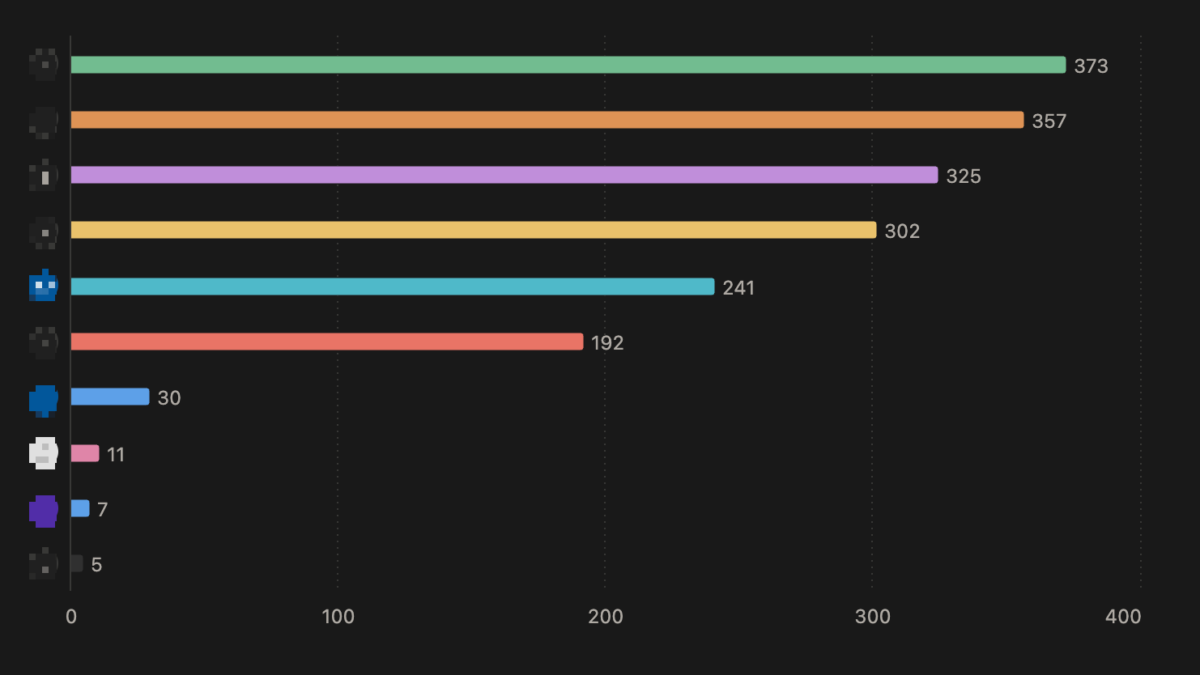
When a new client opportunity comes in, the dashboard gives a clear, data-backed answer about whether there’s capacity – instead of a guess.
Client Health
Every client gets an automatic health score based on task status, overdue work, and activity levels. A client with overdue tasks gets flagged the moment it happens – not when they ask about it.
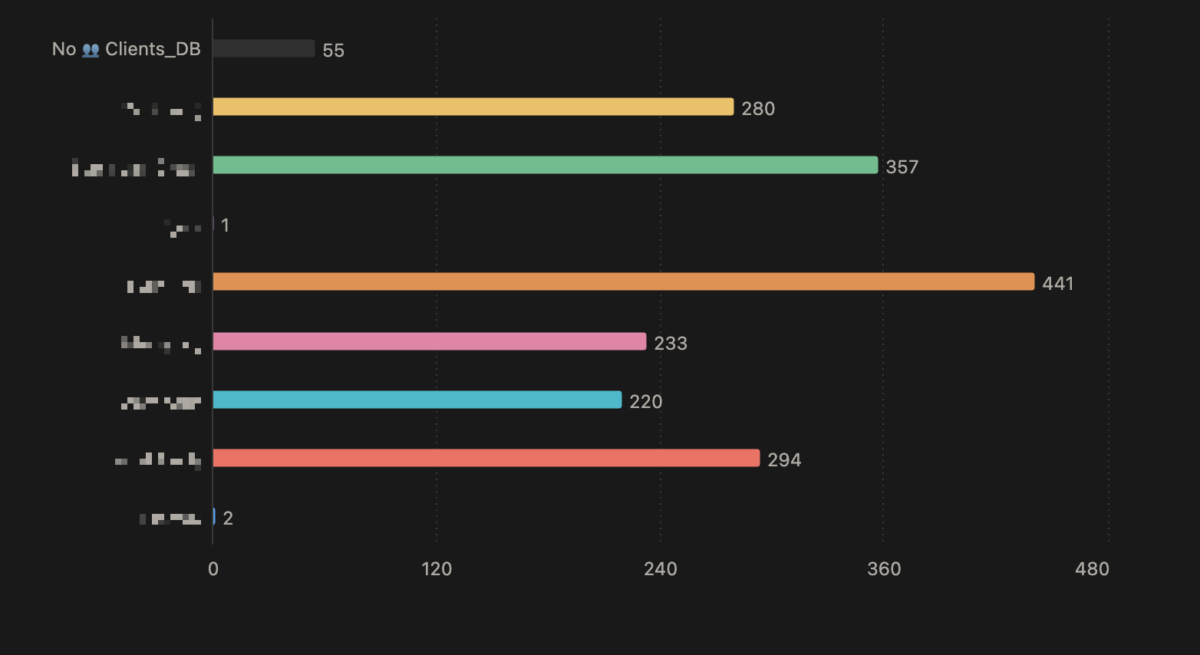
This turned out to be one of the most valuable parts. Before the dashboard, client issues were invisible until they became urgent.
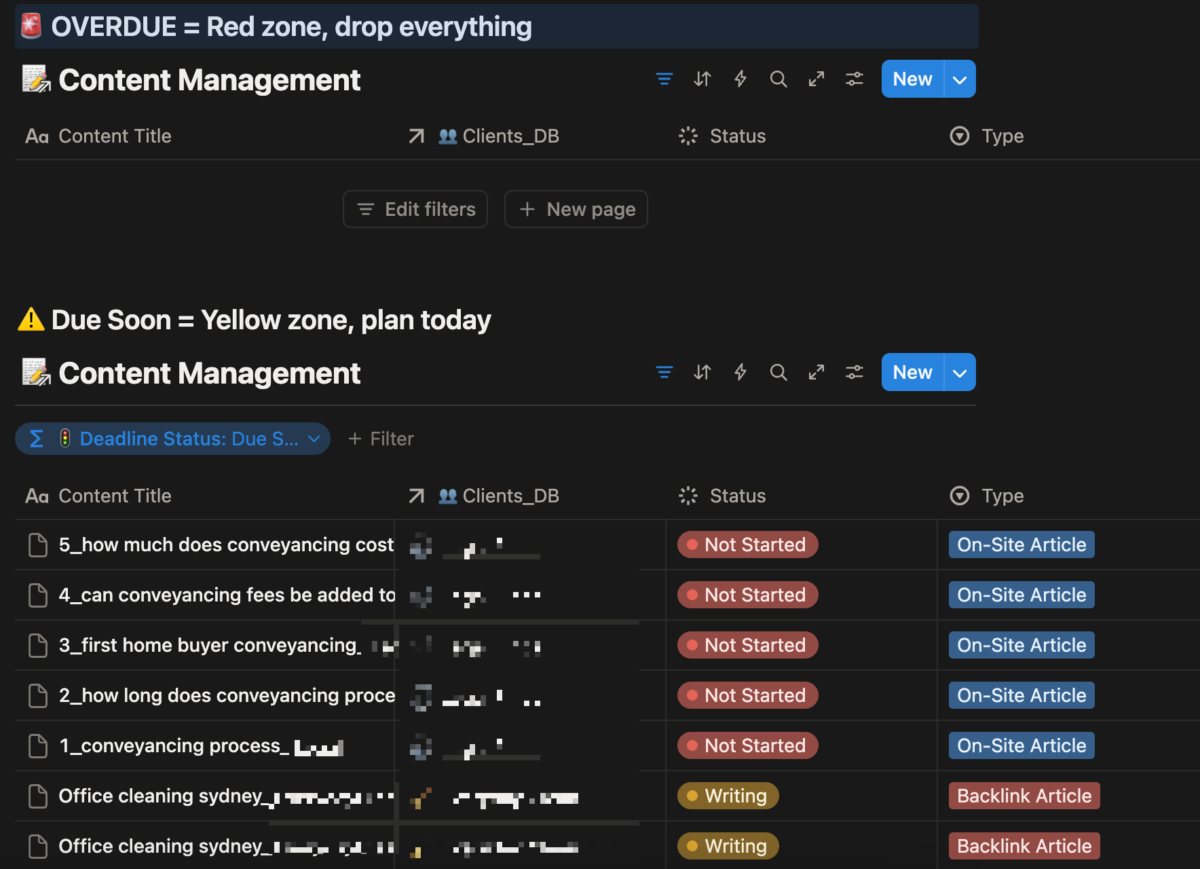
Content Pipeline
A board view shows exactly how many content pieces sit in each workflow stage at any moment. A stall indicator flags any content that hasn’t moved in over a week.
Content bottlenecks were completely invisible before this. Now they’re obvious the moment they happen.
What Changed
Before the dashboard, I spent a significant portion of my week manually checking status across projects, mentally tracking who was overloaded, and hoping nothing slipped through the cracks.
After building it, three things shifted:
Decisions became faster. I could look at one page and know whether to take on a new client, who needed workload redistribution, or which content was stuck – in seconds, not minutes.
Problems surfaced earlier. Overdue tasks, at-risk clients, and pipeline bottlenecks didn’t wait until they became urgent. They showed up as soon as they started.
The team operated more independently. Everyone could see their own utilization and task priorities without waiting for me to brief them. That alone reduced the number of check-ins we needed each week.
The Lesson
The best internal tool isn’t the most complex one. It’s the one that answers real questions automatically and doesn’t require anyone to maintain it.
Three databases. A handful of smart connections between them. One page that ties it all together.
That was enough.
Disclaimer: This article was written with the help of AI. The ideas, experience, and lessons shared here are entirely my own.
Author Profile

- I’m an SEO Manager with 7+ years of experience helping brands grow through data-driven strategies. Passionate about the intersection of search, content, and technology, I blend technical SEO, analytics, and creativity to drive performance and build meaningful digital experiences.
Latest entries
 BlogApril 18, 2026How to Set Up Meta Pixel Events on Haravan via GTM?
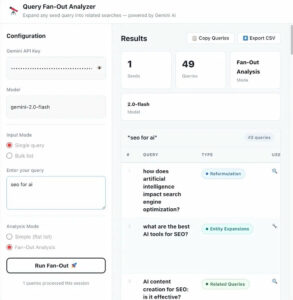
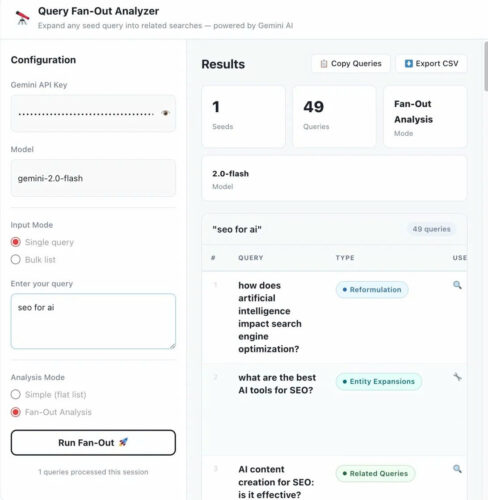
 BlogApril 11, 2026How I Use Query Fan-Out to Write Better Content (And Built a Tool for It)
 BlogApril 11, 2026I Managed 40+ SEO Clients. Google Sheets Broke. Here’s the Notion Template I Built to Fix It.
 BlogMarch 29, 2026I Built an Agency Website in Bricks Builder as a Non-Developer. Here’s What Happened.